World-Class Observability in Delphi: The Unified Telemetry Revolution
In large-scale enterprise environments, where ERP and mission-critical systems are the operational core of major software companies, stability and response times depend directly on one keyword: Observability.
Historically, applications developed in Delphi suffered from a lack of modern instrumentation in production. Debugging database slowdowns, failed HTTP calls, or intermittent errors usually boiled down to the painful analysis of raw text files (local log files) structured in an ad-hoc manner, generating disk I/O bottlenecks and leaving architects blind to distributed transactions.
The Dext Framework definitively breaks this limitation by introducing the S35 — APM Log Sinks & Unified Telemetry Pipeline specification. Now, Delphi developers can rely on a non-blocking, batch-oriented telemetry architecture that fully complies with global industry standards, integrating natively with Seq and OpenTelemetry (OTLP).
1. The Evolution of Dext’s Observability Foundation
Section titled “1. The Evolution of Dext’s Observability Foundation”The S35 specification was not built in a vacuum. It represents the maturity and unification of a series of telemetry and resilience foundations and features that the Dext Framework already brought in its core:
- Structured Log Infrastructure (
ILoggerandILoggerFactory): Dext already had a robust structured logging engine with template support (placeholders) and log aggregation (Aggregate Logger). S35 hooks into this foundation to direct log output to modern sinks. - Diagnostic-Based Interception (
TDiagnosticSource): The reactive and decoupled listening mechanism was already present, allowing transparent monitoring of the lifecycle of HTTP requests and SQL executions. The unified pipeline now consumes these diagnostic events and exports them as structured traces (Spans). - Resilience Pipeline (
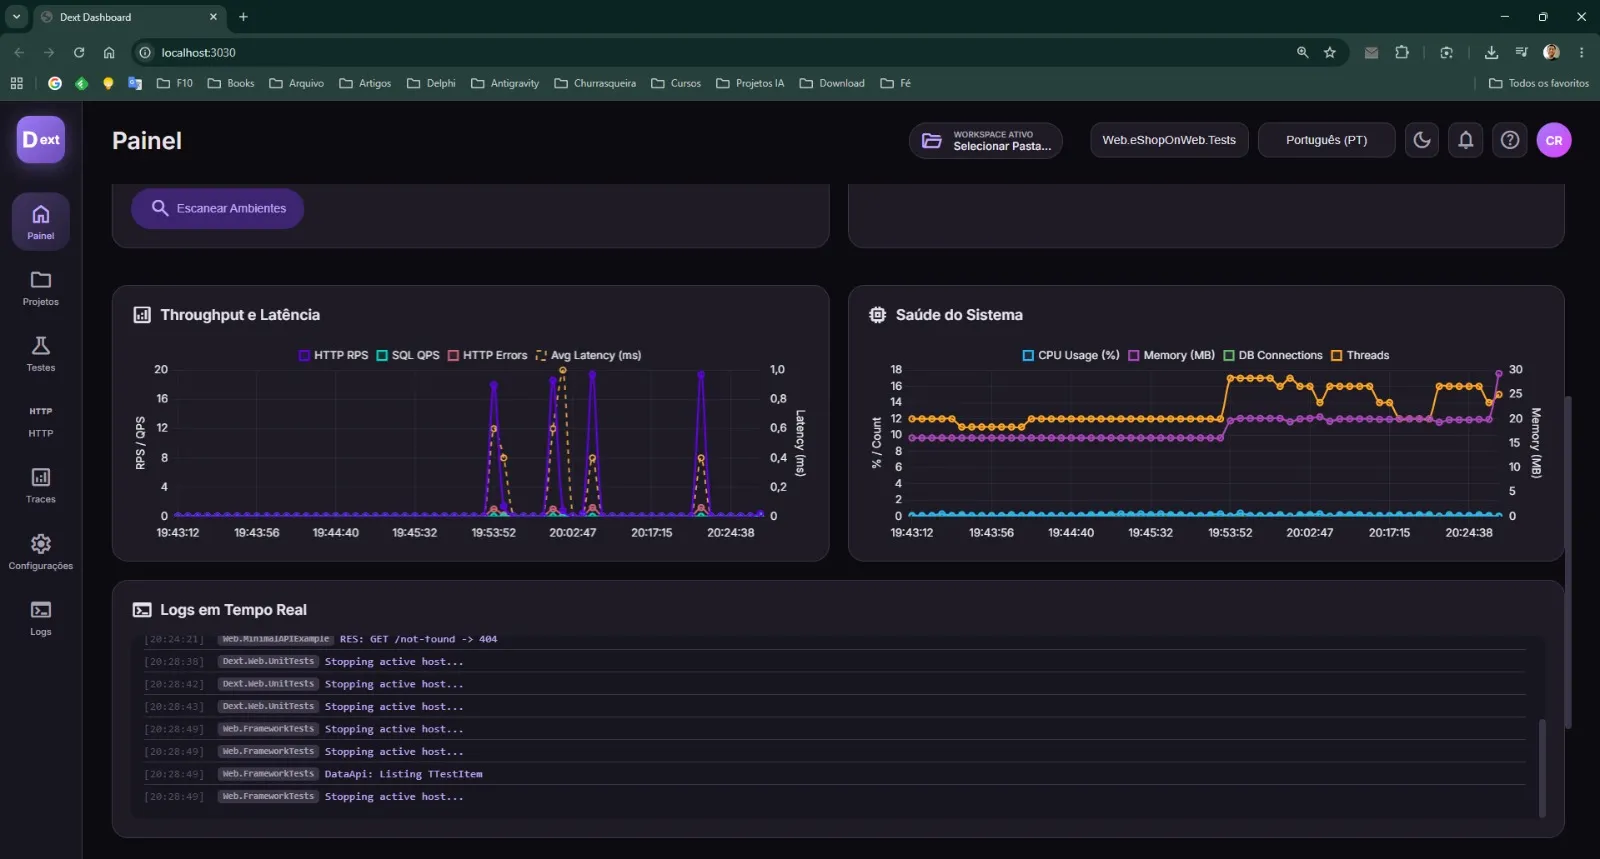
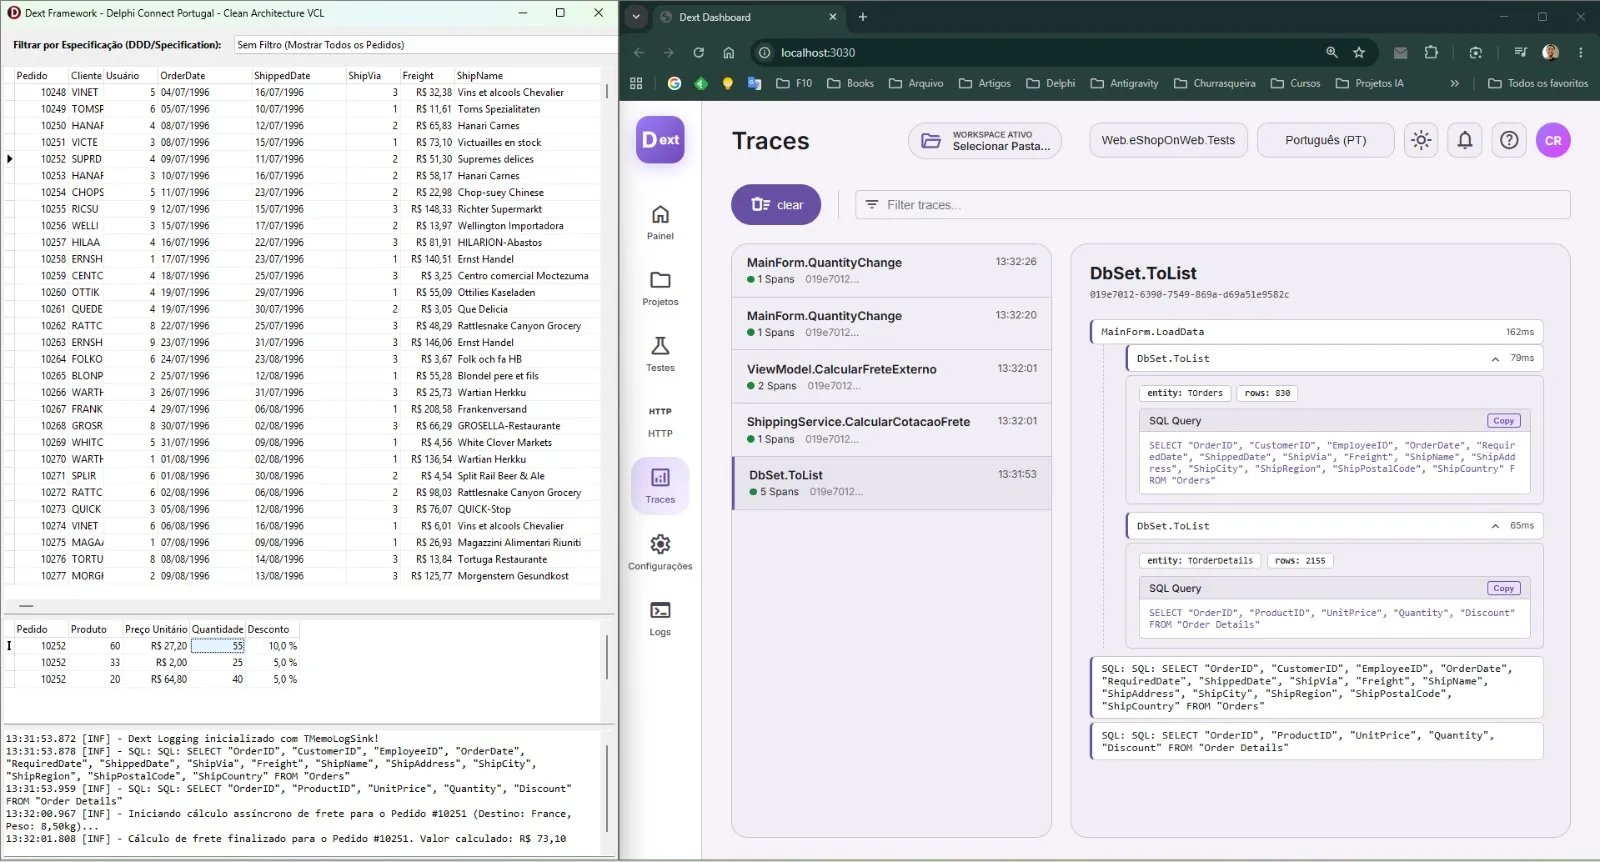
TResiliencePipeline): Inspired by Polly, the retry mechanism with exponential backoff and jitter, circuit breaker, and timeouts already protected application services. Now, this same resilience protects the batch sending of logs and spans against network instability and APM server unavailability. - Dext Sidecar Dashboard: The local tool that provided visual development telemetry evolves with S35 to support instrumentation geared towards multi-tier enterprise production.
2. The Dual-Pipeline Strategy (CLEF & OTLP)
Section titled “2. The Dual-Pipeline Strategy (CLEF & OTLP)”To provide full flexibility from local development environments to the most complex cloud infrastructure, Dext Telemetry implements a two-pipeline strategy:
2.1. Seq Integration (CLEF)
Section titled “2.1. Seq Integration (CLEF)”- Focus: Local development, testing/staging environments, and single-instance deployments.
- Protocol: Structured HTTP/JSON with the CLEF (Compact Log Event Format) format.
- Benefit: Real-time log analysis and querying with excellent developer experience (DevEx), without requiring complex instrumentation on the development machine.
2.2. OpenTelemetry Protocol (OTLP)
Section titled “2.2. OpenTelemetry Protocol (OTLP)”- Focus: Cloud production environments, microservices, and enterprise observability.
- Protocol: OTLP/HTTP transmitting JSON payloads.
- Recommended APM Backend: SigNoz (a high-performance open-source APM suite structured on the ClickHouse analytical engine).
- Integration: Seamlessly compatible with global collectors and dashboards on the market.
3. Tools Supporting the OpenTelemetry Standard (OTLP)
Section titled “3. Tools Supporting the OpenTelemetry Standard (OTLP)”By utilizing the native OTLP standard, Dext allows you to connect your Delphi application directly to virtually any modern monitoring suite on the market, whether commercial or open source:
3.1. Open Source / Self-Hosted Backends
Section titled “3.1. Open Source / Self-Hosted Backends”- SigNoz (Recommended): Full monitoring (metrics, logs, and traces) in a single ClickHouse-based interface.
- Jaeger: Excellent tool focused exclusively on Distributed Tracing.
- Zipkin: One of the pioneers in distributed tracking, simple and efficient.
- Grafana Stack (Tempo & Loki): Focused on high-performance analytical logs and tracing integrated with Grafana dashboards.
- Apache SkyWalking: Full APM for tracking mission-critical applications.
- Uptrace: Modern, lightweight open-source alternative for OTLP telemetry aggregation.
3.2. Commercial and SaaS Enterprise Solutions
Section titled “3.2. Commercial and SaaS Enterprise Solutions”- Datadog: Leading cloud monitoring and performance analysis platform.
- Dynatrace: AI-powered software intelligence platform.
- New Relic: Unified observability and transaction monitoring.
- Elastic APM: Integrated into the Elasticsearch/Kibana ecosystem for telemetry search and analysis.
- Honeycomb: Specialized in high-cardinality telemetry analysis for production debugging.
- Splunk: Powerful machine data analysis and operational monitoring for security and performance.
- Cloud-Native Providers: AWS X-Ray, Azure Monitor (Application Insights), and Google Cloud Trace.
4. Where Telemetry Occurs Automatically (Dext Coverage)
Section titled “4. Where Telemetry Occurs Automatically (Dext Coverage)”One of the greatest advantages of Dext’s architecture is out-of-the-box instrumentation. The framework takes advantage of internal hooks in the pre-existing TDiagnosticSource to automatically capture and map tracking metadata across the main application layers:
- Web Request Pipeline (HTTP/REST): All requests entering the API are intercepted by the web handler invoker, generating a root span containing route, HTTP verb, route parameters, headers, return status code, and total processing time.
- Persistence and Database (ORM/DbSet): Dext’s database profiler intercepts and monitors SQL command executions. Each query executed on the database generates a child span associated with the current HTTP transaction, reporting the executed command (sanitized of sensitive parameters), connection pool, and exact query latency.
- External Calls (RestClient): Integrations with third-party services via HTTP client generate spans that measure external network call latency, helping to identify if request delays were caused by slow external APIs.
- Minimal APIs & Middlewares: Traffic time between framework middlewares is also exposed in the trace tree.
5. Non-Blocking Architecture Under the Hood
Section titled “5. Non-Blocking Architecture Under the Hood”To ensure that telemetry does not degrade the API’s requests per second (RPS) throughput, Dext adopts a thread-safe ring buffering model:
[Application Flow] │ (Generates instant logs/spans) ▼[Thread-Safe Ring Buffer Queue] ──► No locks on Main Thread (Zero Latency) │ ▼ (Asynchronously consumed)[TLogConsumerThread] │ ▼ (Smart grouping in batches)[TBatchingTelemetrySink] ──► Auto-retry with Exponential Backoff via Resilience Pipeline │ ▼ (HTTP POST in Background)[Centralized APM (Seq / SigNoz / Datadog)]The role of the Resilience Pipeline in sending logs
Section titled “The role of the Resilience Pipeline in sending logs”At the heart of the TBatchingTelemetrySink, telemetry batch delivery is wrapped in a resilience policy based on TResiliencePipeline. If the SigNoz, Seq, or Datadog collector becomes temporarily unavailable due to a network glitch, the sink initiates smart retries without locking the Delphi application, ensuring no critical production logs or traces are lost.
6. Simplified Configuration
Section titled “6. Simplified Configuration”Dext’s unified telemetry configuration can be done declaratively via a JSON file or directly in Delphi code.
6.1. Configuration via appsettings.json
Section titled “6.1. Configuration via appsettings.json”{ "Dext": { "Telemetry": { "Seq": { "Enabled": true, "Endpoint": "http://localhost:5341", "ApiKey": "YOUR_API_KEY_HERE" }, "OpenTelemetry": { "Enabled": true, "Endpoint": "http://localhost:4318", "ServiceName": "FaturamentoAPI", "Environment": "Production", "ExportLogs": true, "ExportTraces": true } } }}6.2. Programmatic Registration on Startup
Section titled “6.2. Programmatic Registration on Startup”uses Dext.Logging, Dext.Logging.Sinks.APM;
// Register Seq for local structured logsLog.AddSink(TSeqLogSink.Create( 'http://localhost:5341', 'YOUR_API_KEY_HERE', TBatchOptions.Create.BatchSize(100).FlushInterval(5000)));
// Register OpenTelemetry (SigNoz/Datadog Collector) for distributed tracingTelemetry.AddSink(TOTLPTelemetrySink.Create( 'http://localhost:4318', TTelemetryOptions.Create .ServiceName('FaturamentoAPI') .Environment('Production') .EnableTraces(True) .EnableLogs(True)));7. Custom Spans in Practice: The Magic of Self-Managed TSpan
Section titled “7. Custom Spans in Practice: The Magic of Self-Managed TSpan”In addition to the framework’s automatic tracking, business developers can enrich telemetry with custom spans to highlight critical processes within the ERP or financial system.
Dext uses the TSpan structured type (based on a Delphi interface wrapper). This pattern leverages Delphi’s automatic scope destruction: the span closes automatically (calls Finish) as soon as the execution block that declared it ends, eliminating resource leaks due to forgotten try-finally blocks.
uses  System.SysUtils,  Dext.Logging.Tracing;
procedure TProcessoFaturamento.ProcessarLote(const LoteId: string);var  Span: TSpan; // The compiler will manage the lifecycle of this recordbegin  // Starts a new Span. Dext detects if there is already an active web transaction  // on the thread and nests this Span as a child automatically.  Span := TTracer.BeginSpan('ProcessarLoteFaturamento', 'BILLING');  Span.SetAttribute('lote.id', LoteId);  Span.SetAttribute('empresa.contexto', 'Corporativo-Matriz');
  try    // 1. Run business rule validation    ValidarItensDoLote(LoteId);
    // 2. Register additional success metadata    Span.SetAttribute('lote.itens_processados', 150);    Span.SetAttribute('faturamento.processado_com_sucesso', True);
  except    on E: Exception do    begin      // Change the span status to Error and attach the exception message      Span.SetStatus(tsError, E.Message);      raise;    end;  end;end; // <-- End of procedure. The Span "Billing" automatically calls Finish here!
With this code snippet, in APM visualization tools, software engineers can inspect the complete application execution flow in a Gantt-chart format:
├─ GET /api/v1/faturamento/lote/1002 [HTTP REQ] --------------------------- (210ms)│ ├─ TProcessoFaturamento.ProcessarLote [BILLING] ---------------- (180ms)│ │ ├─ SELECT * FROM lotes WHERE id = ? [SQL QUERY] --------- (15ms)│ │ ├─ POST /oauth/v2/token [HTTP REST CLIENT] -------------- (90ms)│ │ └─ UPDATE lotes SET status = ? WHERE id = ? [SQL] ------- (18ms)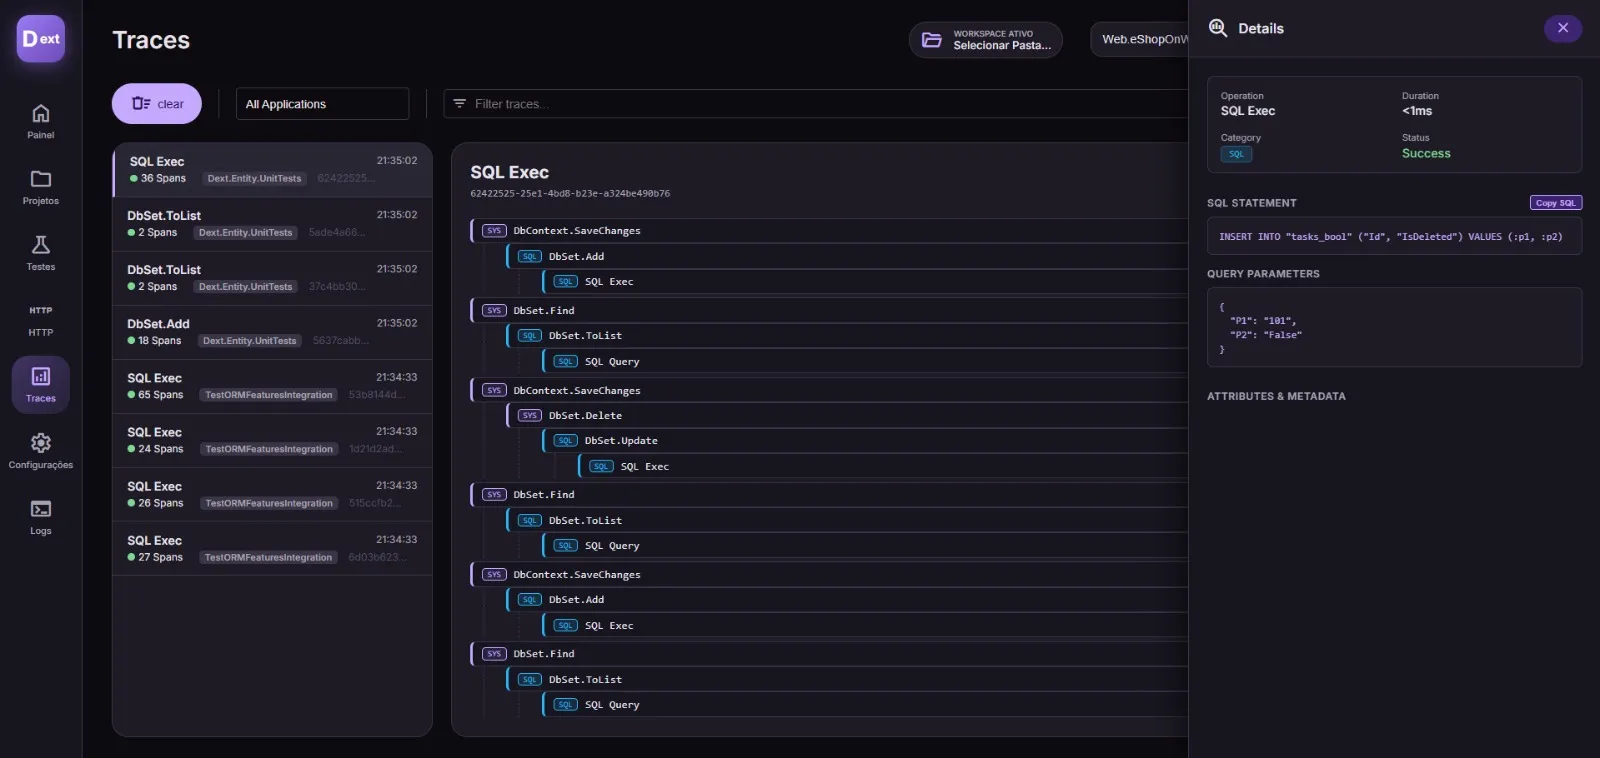
Tracking SQL query latency and the full flow side by side with structured logs in the backend drastically simplifies enterprise performance analysis.
8. Conclusion: Delphi Heading to the Enterprise Cloud
Section titled “8. Conclusion: Delphi Heading to the Enterprise Cloud”With unified telemetry based on OpenTelemetry, the Dext Framework elevates legacy systems and new products written in Delphi to the same level of operational maturity as modern platforms written in Go, Rust, or Java.
By adopting Dext with asynchronous exporters for enterprise solutions compatible with OpenTelemetry and Seq, development teams ensure full real-time visibility into the health and behavior of their applications, reducing the Mean Time to Resolution (MTTR) from hours to just seconds.
Telemetry Documentation: Read Technical Details
Like Dext? Access the official GitHub repository to contribute, leave a star, and follow its development: https://github.com/cesarliws/dext